
Your source can also include Advanced Data Fields. Advanced data fields automate chart formatting and can be used to identify assistant boxes, insert sub-chart breaks, hide branches, or specify the chart styles of selected branches. In addition, advanced data fields can also be used to identify rows to ignore during the import process.
In order to use advanced data fields, you must include a header row in your import file. The header must with contain columns that correspond to each utilized advanced data field. If you are importing from a database, the fields in the source database table (or view) must be named to match an advanced data field. A typical Excel import file would be constructed as follows:
|
ID |
ReportsTo |
Name |
Title |
IsAssistant |
BreakAt |
|
1 |
|
Lynn Brewer |
CEO |
0 |
0 |
|
2 |
1 |
Larry Stevens |
Assistant |
1 |
0 |
|
3 |
1 |
Claire Chancellor |
VP |
0 |
1 |
The following sections describe the available advanced data fields:
If the IsAssistant field is included in an import file, OrgPlus can automatically format assistants in your chart. Setting IsAssistant to 1 for a record makes the corresponding box an assistant.
For example, if the IsAssistant field for Corinne Speer is set to 1 in the import file, the resulting chart is formatted as follows:
Note: You can specify an assistant branch style in the IsAssistant column (refer to the table in the BranchStyle section below).
If the BreakAt field is included in an import file, OrgPlus automatically inserts a sub-chart break for the corresponding record.
╖ Setting BreakAt to 0 does not insert a sub-chart break.
╖ Setting BreakAt to 1 inserts a sub-chart break.
╖ Setting BreakAt to a text string (such as, Marketing) inserts a sub-chart break and names the sub-chart based on the text.
If the CollapseAt field is included in an import file, OrgPlus automatically collapses or expands the branch associated with each box. Setting CollapseAt to 1 collapses a branch.
Using the BranchStyle field allows you to define the chart style for each branch in your chart. By default, charts created using the Import Wizard select chart styles that minimize the total number of pages and optimize the distribution of boxes on each page.
The following branch styles are available:
|
Branch Style |
Name |
Branch Style |
Name |
|
|
TreeStyle |
|
ListStyle |
|
|
TreeLeftStyle |
|
LeftListStyle |
|
|
TreeRightStyle |
|
BoxListStyle |
|
|
TreeStaggerStyle |
|
BoxListLeftStyle |
|
|
TreeStaggerLeftStyle |
|
BoxListRightStyle |
|
|
TreeStaggerRightStyle |
|
SuperiorBoxListStyle |
|
|
TwoColumnStyle |
|
Assistant1Style |
|
|
TwoColumnTreeStyle |
|
Assistant2Style |
|
|
FourColumnStyle |
|
Assistant3Style |
|
|
FourColumnTreeStyle |
|
Assistant4Style |
|
|
OneColumnStyle |
|
Assistant5Style |
|
|
OneColumnLeftStyle |
|
Assistant6Style |
|
|
OneColumnCenterStyle |
|
Assistant7Style |
|
|
OneColumnLeftCenterStyle |
|
Assistant8Style |
|
|
OneColumnEdgeLeft |
|
OneColumnEdgeRight |
|
|
MultiColumnLine |
|
CoManagerStyle |
|
|
MultiColumnPair |
|
|
The Sequence field allows you to control the order in which subordinate boxes are arranged under a manager. Boxes are sequenced from left to right and then top to bottom.
For example, importing the following data à
|
ID |
ReportsTo |
Name |
Title |
Sequence |
|
1 |
|
Lynn Brewer |
CEO |
0 |
|
2 |
1 |
Larry Stevens |
VP Sales |
3 |
|
3 |
1 |
Claire Chancellor |
VP Engineering |
2 |
|
4 |
1 |
Fred Barnes |
VP Marketing |
1 |
à would create the following chart:

Notice that Larry Stevens, assigned sequence number 3, is third from the left.
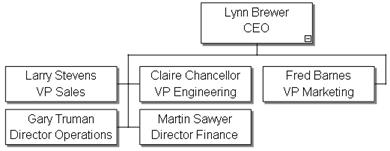
The Sequence field can also be used to sequence subordinates in multiple rows and columns beneath a manager. To achieve this, enter row number and sequence number separated by a : for each import record.
For example, importing the following data à
|
ID |
ReportsTo |
Name |
Title |
Sequence |
|
1 |
|
Lynn Brewer |
CEO |
0 |
|
2 |
1 |
Larry Stevens |
VP Sales |
1:1 |
|
3 |
1 |
Claire Chancellor |
VP Engineering |
1:2 |
|
4 |
1 |
Fred Barnes |
VP Marketing |
1:3 |
|
5 |
1 |
Gary Truman |
Director Operations |
2:1 |
|
6 |
1 |
Martin Sawyer |
Director Finance |
2:2 |
à would create the following chart:
The Exclude field allows you to determine how each box in your chart is handled with respect to calculations.
╖ Setting Exclude to 0 includes a box in all counts and calculations.
╖ Setting Exclude to 1 excludes a box from all counts and calculations.
╖ Setting Exclude to 2 excludes a box from all counts.
╖ Setting Exclude to 3 excludes a box from all calculations.
The Format field allows you to specify the format for any given box. The example below contains a subset of available options. See the OrgPlus Knowledge Base at www.orgplus.com/support for more information on the Format advanced data field.
|
ID |
ReportsTo |
Name |
Title |
Format |
|
1 |
|
Lynn Brewer |
CEO |
fields_show=öName, Titleö, font=öVerdana,12, blueö |
|
2 |
1 |
Larry Stevens |
VP Sales |
fields_show=öName,ö, font=öVerdana, 9ö, box=öround_rectö |
|
3 |
1 |
Claire Chancellor |
VP Engineering |
fields_show=öName,ö, font=öVerdana, 9ö, box=öround_rectö |
|
4 |
1 |
Fred Barnes |
VP Marketing |
fields_show=öName,ö, font=öVerdana, 9ö, box=öround_rectö |
The Special field allows you to specify chart formatting parameters such as chart title and chart background color. See the OrgPlus Knowledge Base at www.orgplus.com/support for more information on the Special field.
|
ID |
ReportsTo |
Name |
Title |
Special |
Format |
|
|
|
|
|
title=öMy Corpö |
font= ôVerdana, 24ö |
|
|
|
|
|
chart_fill=ösolidfill, greenö |
|
|
1 |
|
Lynn Brewer |
CEO |
|
|
|
2 |
1 |
Larry Stevens |
VP Sales |
|
|
|
3 |
1 |
Claire Chancellor |
VP Engineering |
|
|
The Special field can also be used to ignore any row from the import data source. For example, as shown below, an Excel file containing a summary row.
|
ID |
ReportsTo |
Name |
Title |
Salary |
Special |
|
1 |
|
Lynn Brewer |
CEO |
125,000 |
|
|
2 |
1 |
Larry Stevens |
VP Sales |
75,000 |
|
|
3 |
1 |
Claire Chancellor |
VP Engineering |
100,000 |
|
|
|
|
|
Total |
300,000 |
Ignore |
The AuxReportsTo field allows you to specify one or more auxiliary reporting relationship within your chart.
Importing the following data:
|
ID |
ReportsTo |
AuxReportsTo |
Name |
Title |
|
1 |
|
|
Lynn Brewer |
CEO |
|
2 |
1 |
|
Larry Stevens |
VP Sales |
|
3 |
1 |
|
Claire Chancellor |
VP Engineering |
|
4 |
1 |
|
Fred Barnes |
VP Marketing |
|
5 |
2 |
4 |
Gary Truman |
Director Sales/Marketing |
|
6 |
3 |
|
Martin Sawyer |
Director Engineering |
Would result in the following chart:

Note: Multiple auxiliary reporting relationships for a single record must be separated by semi-colons.